Week Five AI Housing Team
AI models
First a model was made following the graphic from last week, the only added characteristics include a variable to hold the best image once it is selected, a variable to track if an image was randomly chosen by the algorithm, and that the program exits if no good picture is available. Otherwise the algorithm’s skeleton is made as planned reading in images from a folder, a spot to add models that evaluate image quality, spots to evaluate characteristics, then finally a section to write to a csv file. Minimal code was added to the skeleton at the beginning of the week.
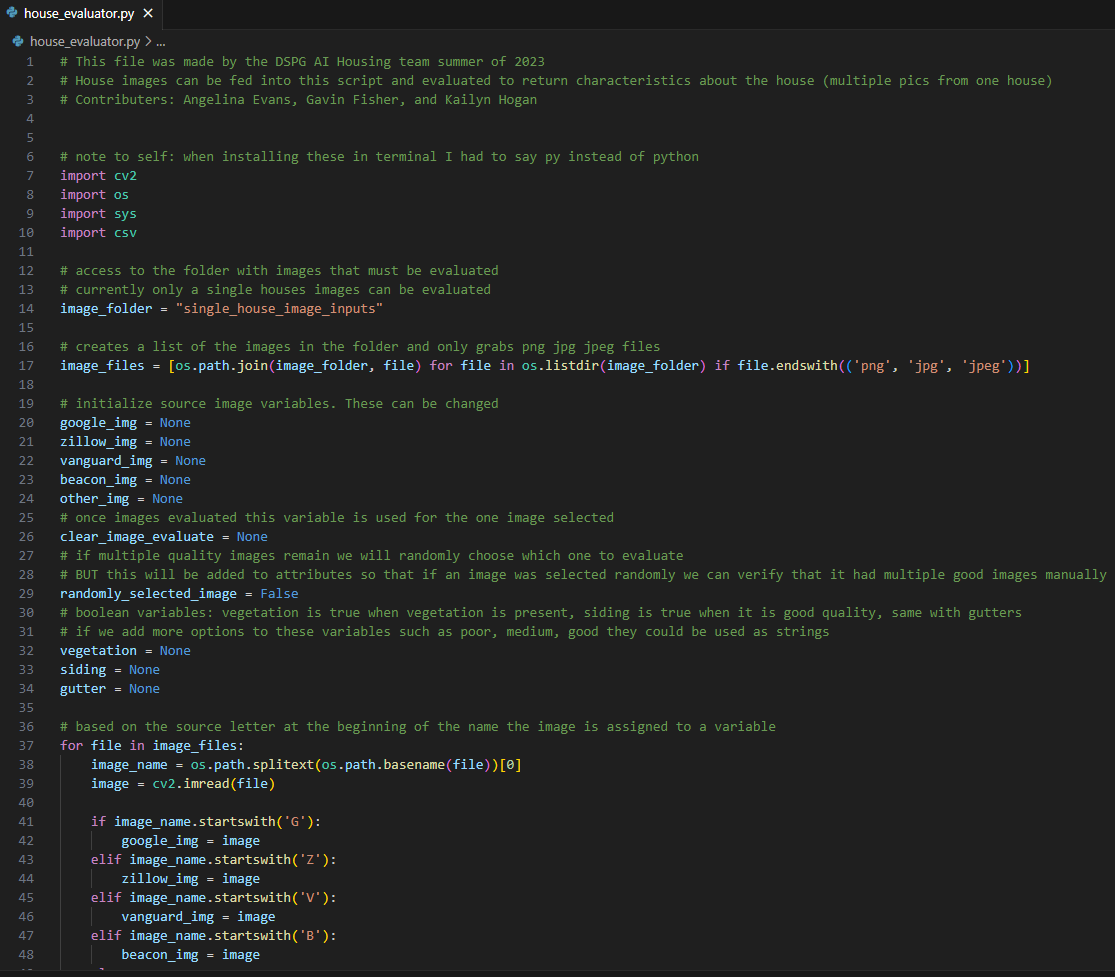
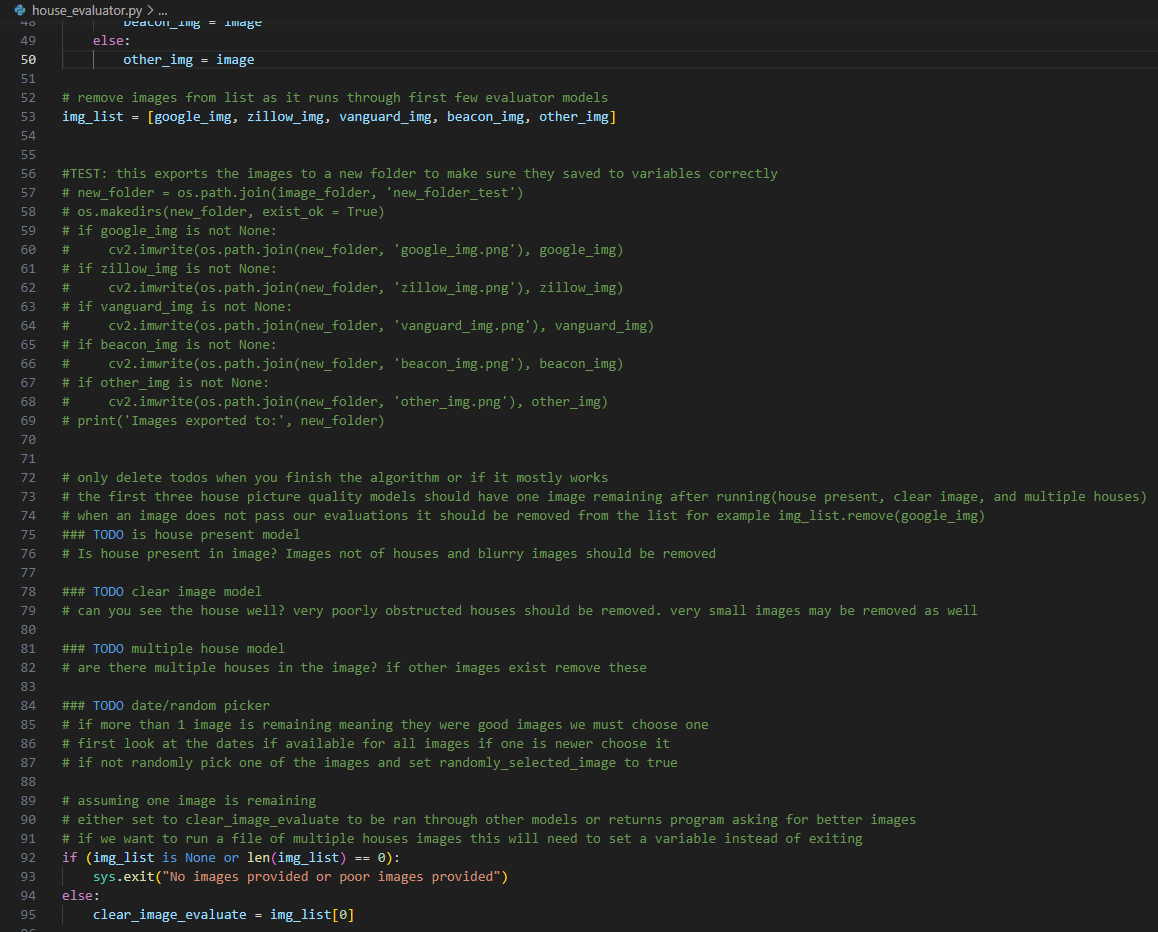
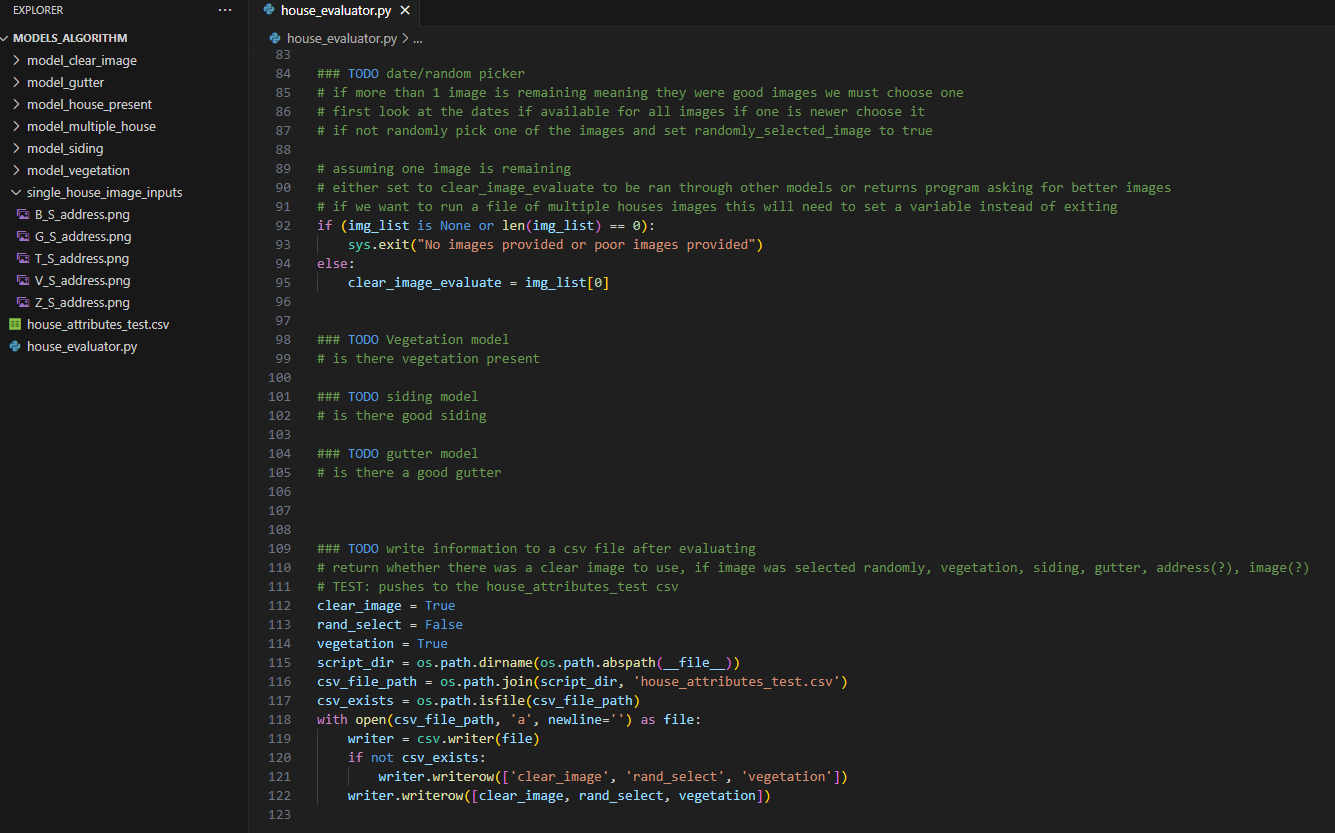
After the initial Skeleton code was made the first vegetation model was used to demonstrate how we would read in the models that we create then push images through the model to get a prediction of the output.
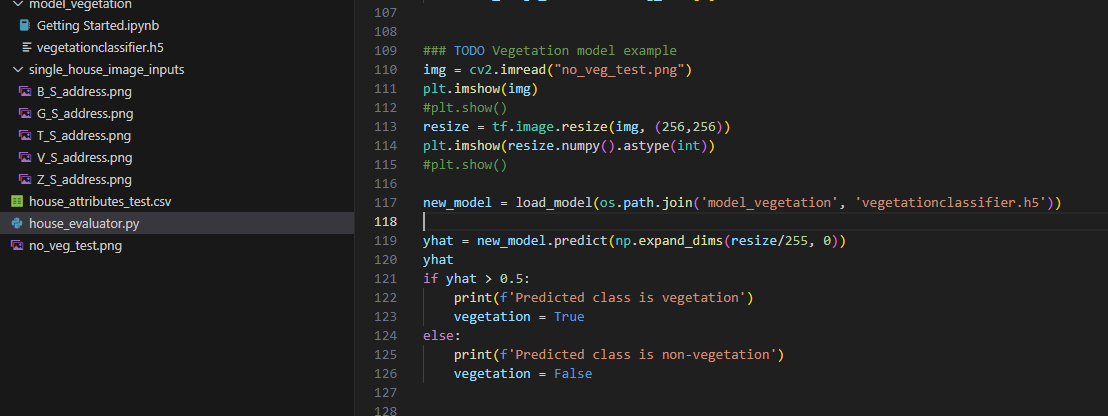
Next using the original vegetation model as an example our team was able to create five additional models in Google Colab, house present model, clear image model, multiple houses model, vegetation model (new), and the siding model. The gutter model will be added later once images of damaged gutters are obtained. Images downloaded from the Google API had to be sorted into 2-3 categories for each model in order to train. Sorting is definitely in the crappies category due to it taking hours with a lack of poor images resulting. We will need to find a more efficient way to sort images for model training than moving images into folders.
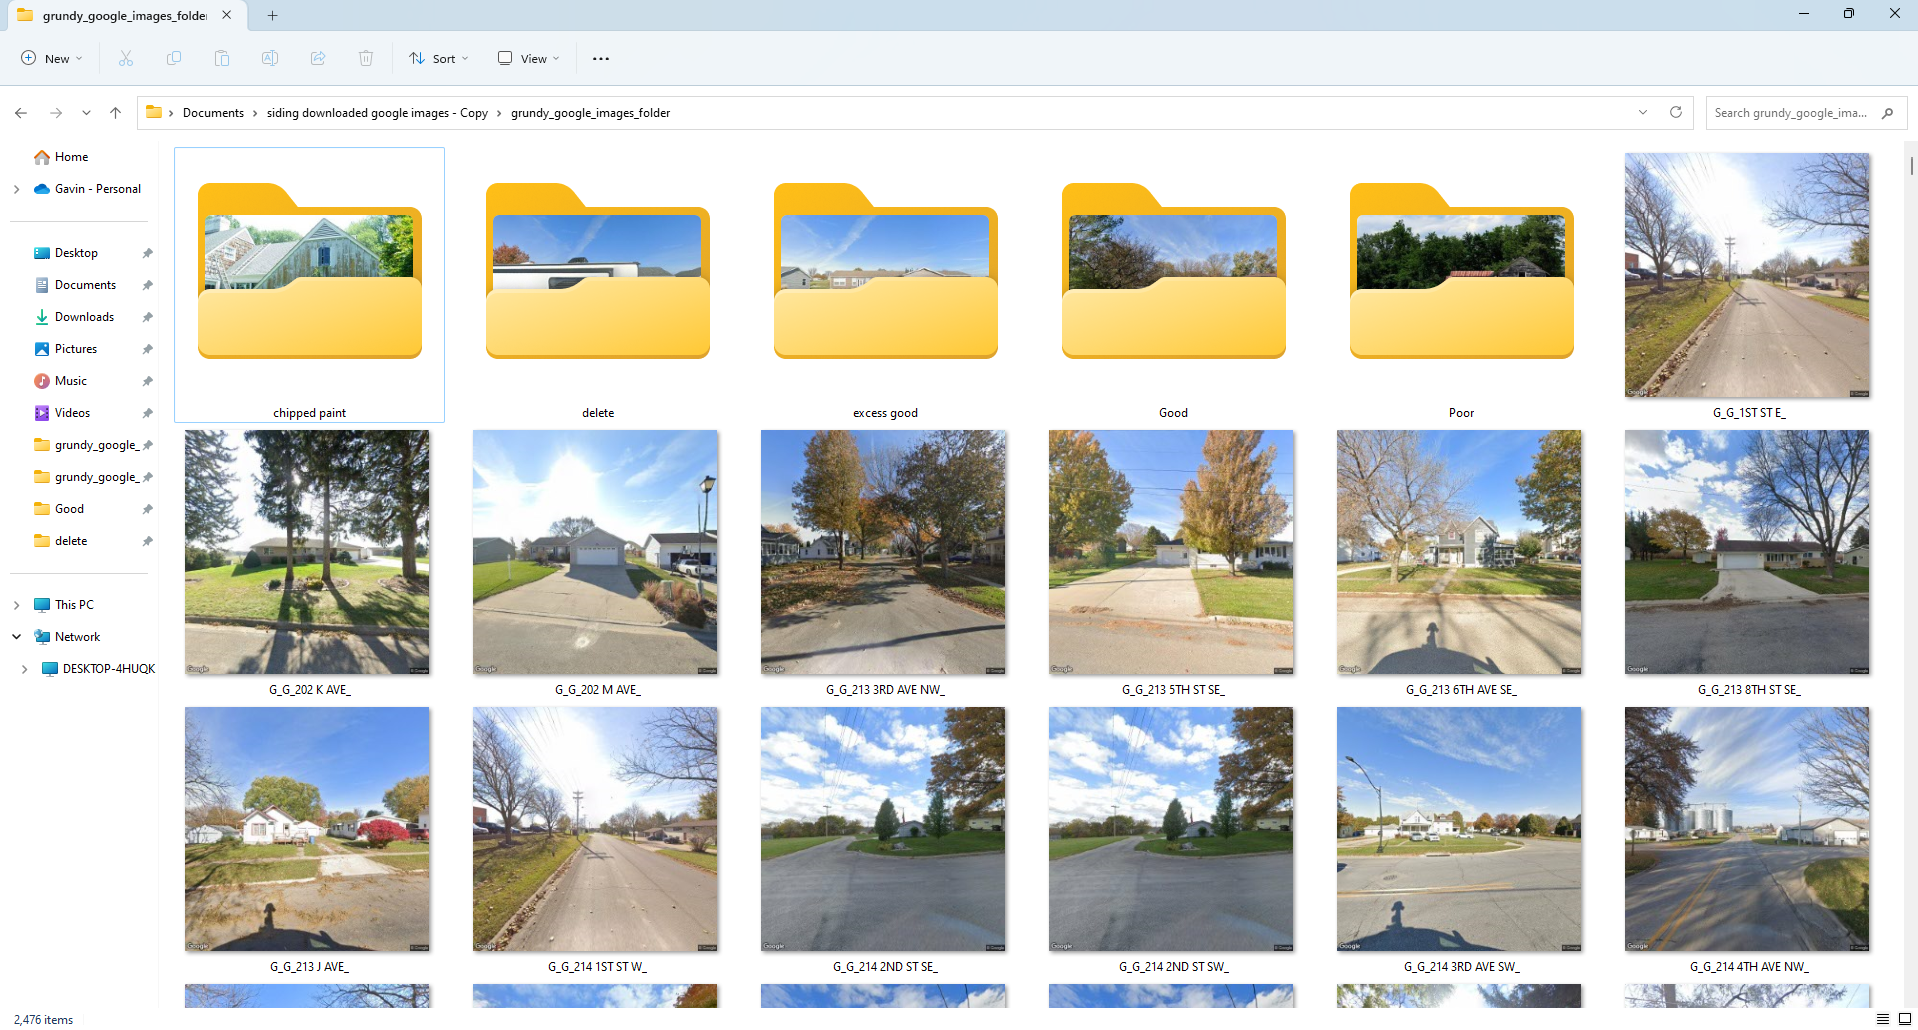
Most of the models were very inaccurate due to the lack of data on poor house images. For example for the siding model there were plenty of images of good siding, less images with chipped paint, and very few images with broken siding panels.
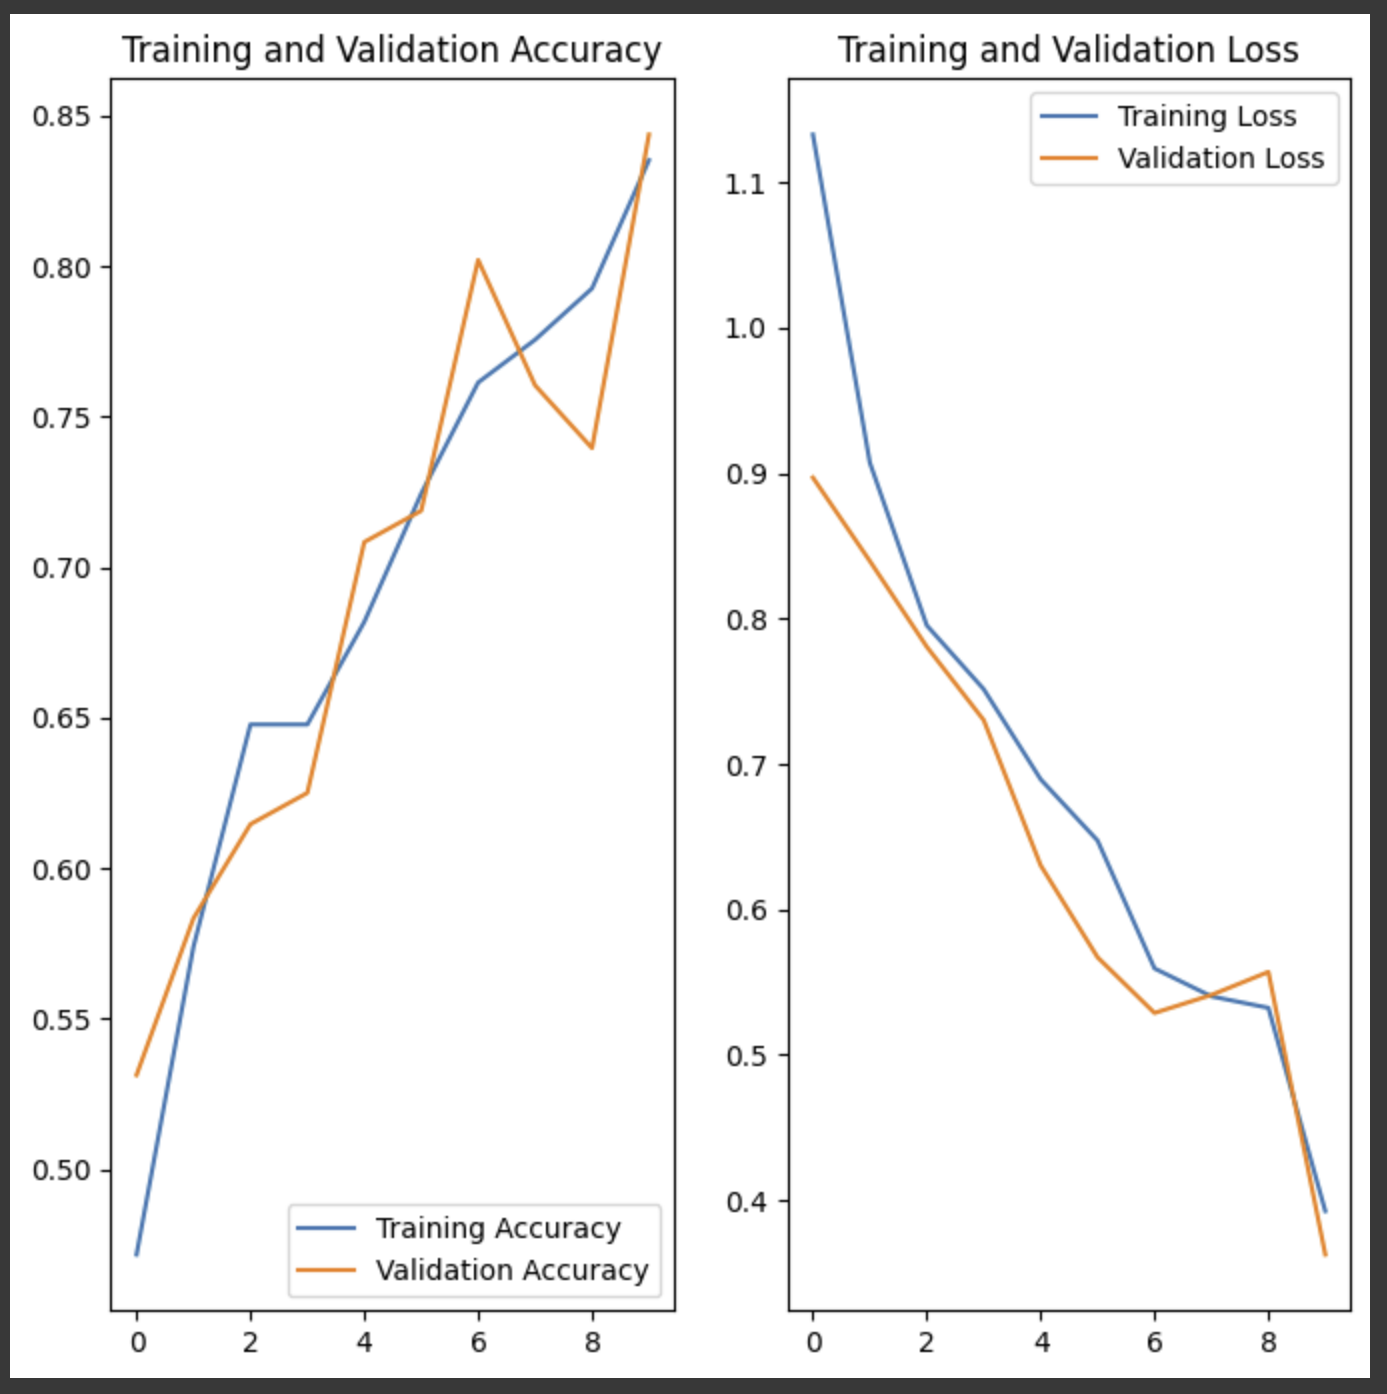
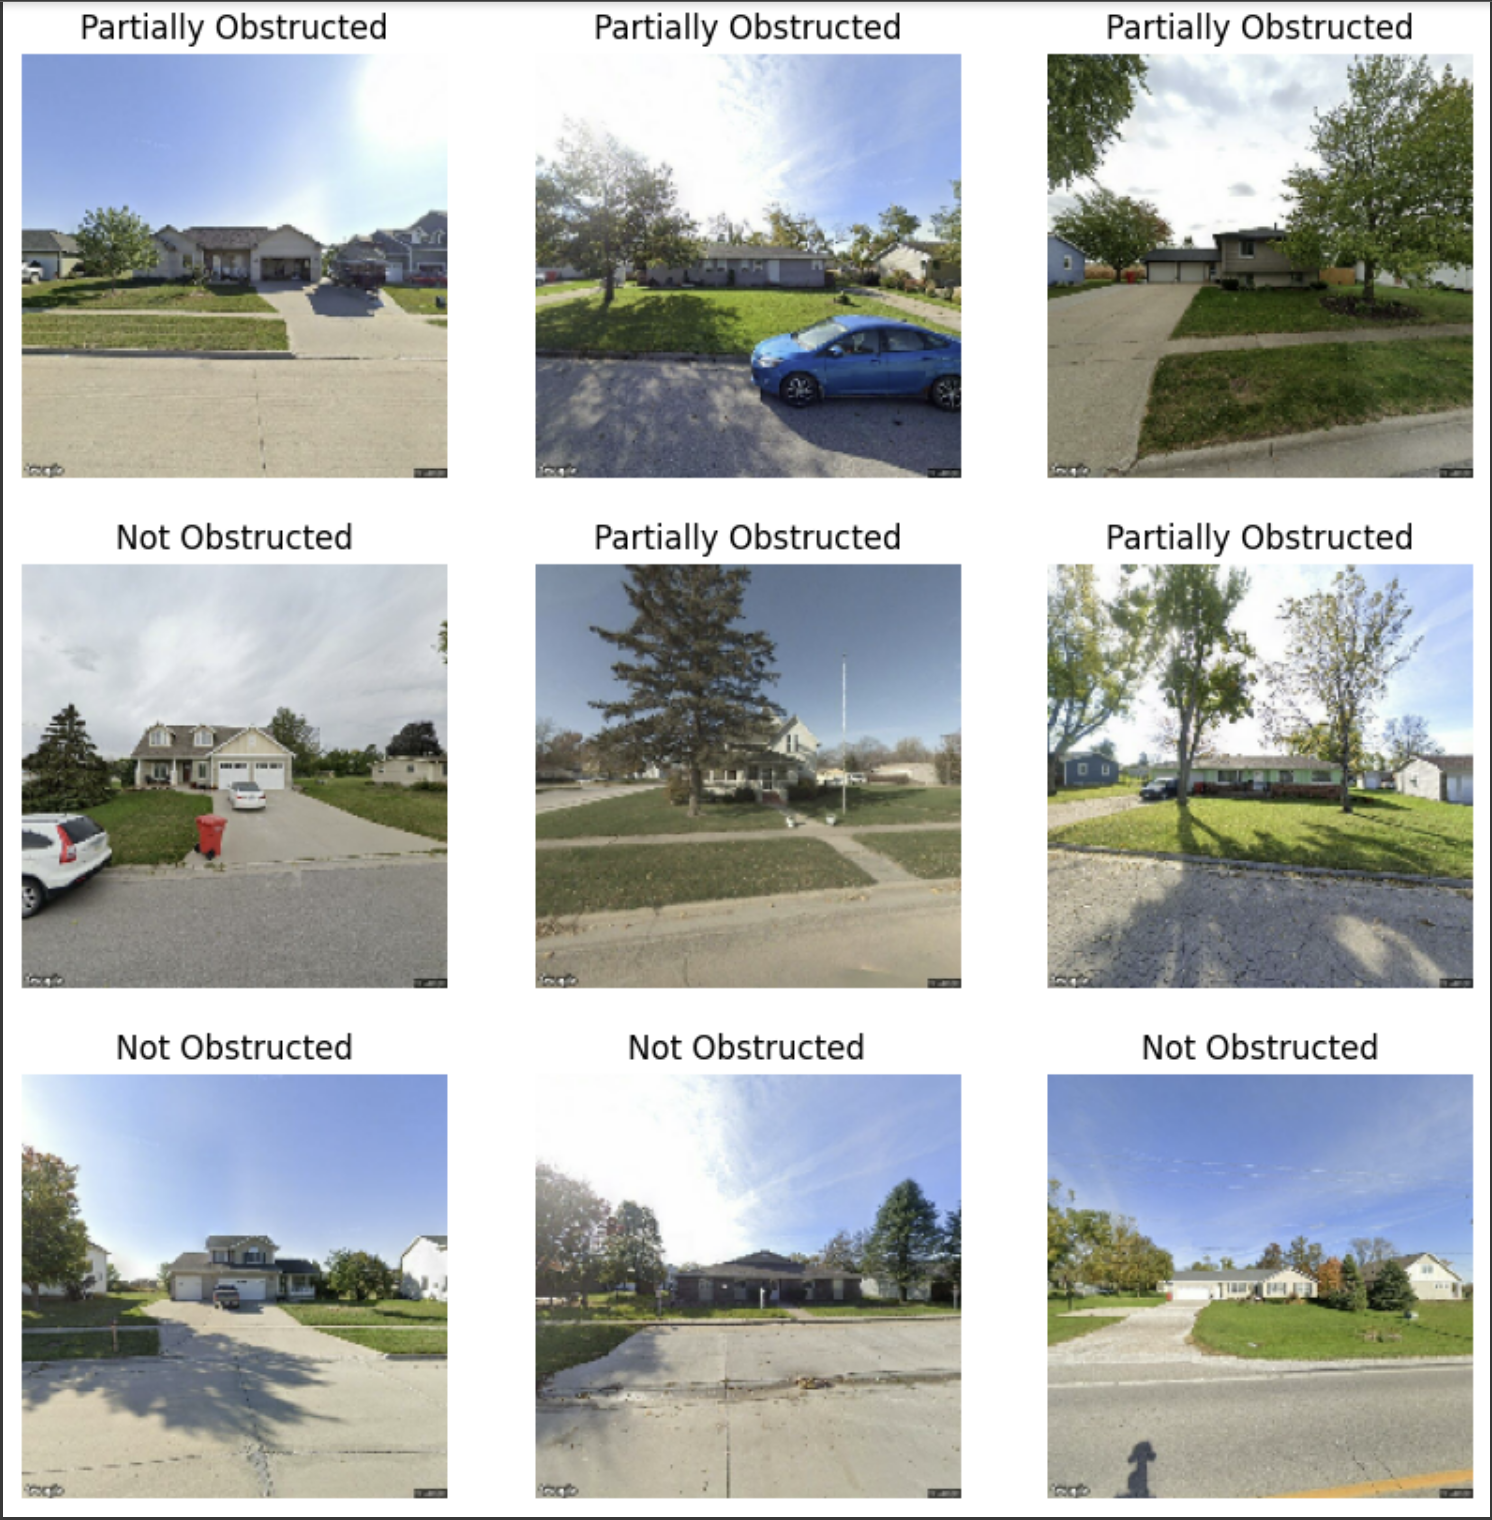
The new model also shows the sample images in a more comprehensible way by showing the label names rather than just a binary label.
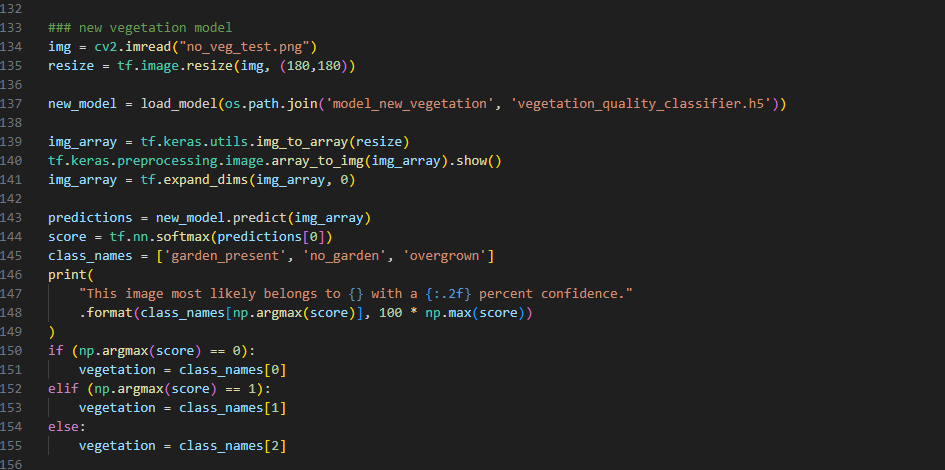
Finally after making the initial models they were added to the house_evaluator python script. Currently, the program prints the values returned by the models to a test CSV. Once more training images are obtained to improve the models accuracy the python script will print the results to the address of the images provided in the houses_databases CSV files. This image shows how the models with more than one label can return multiple options.
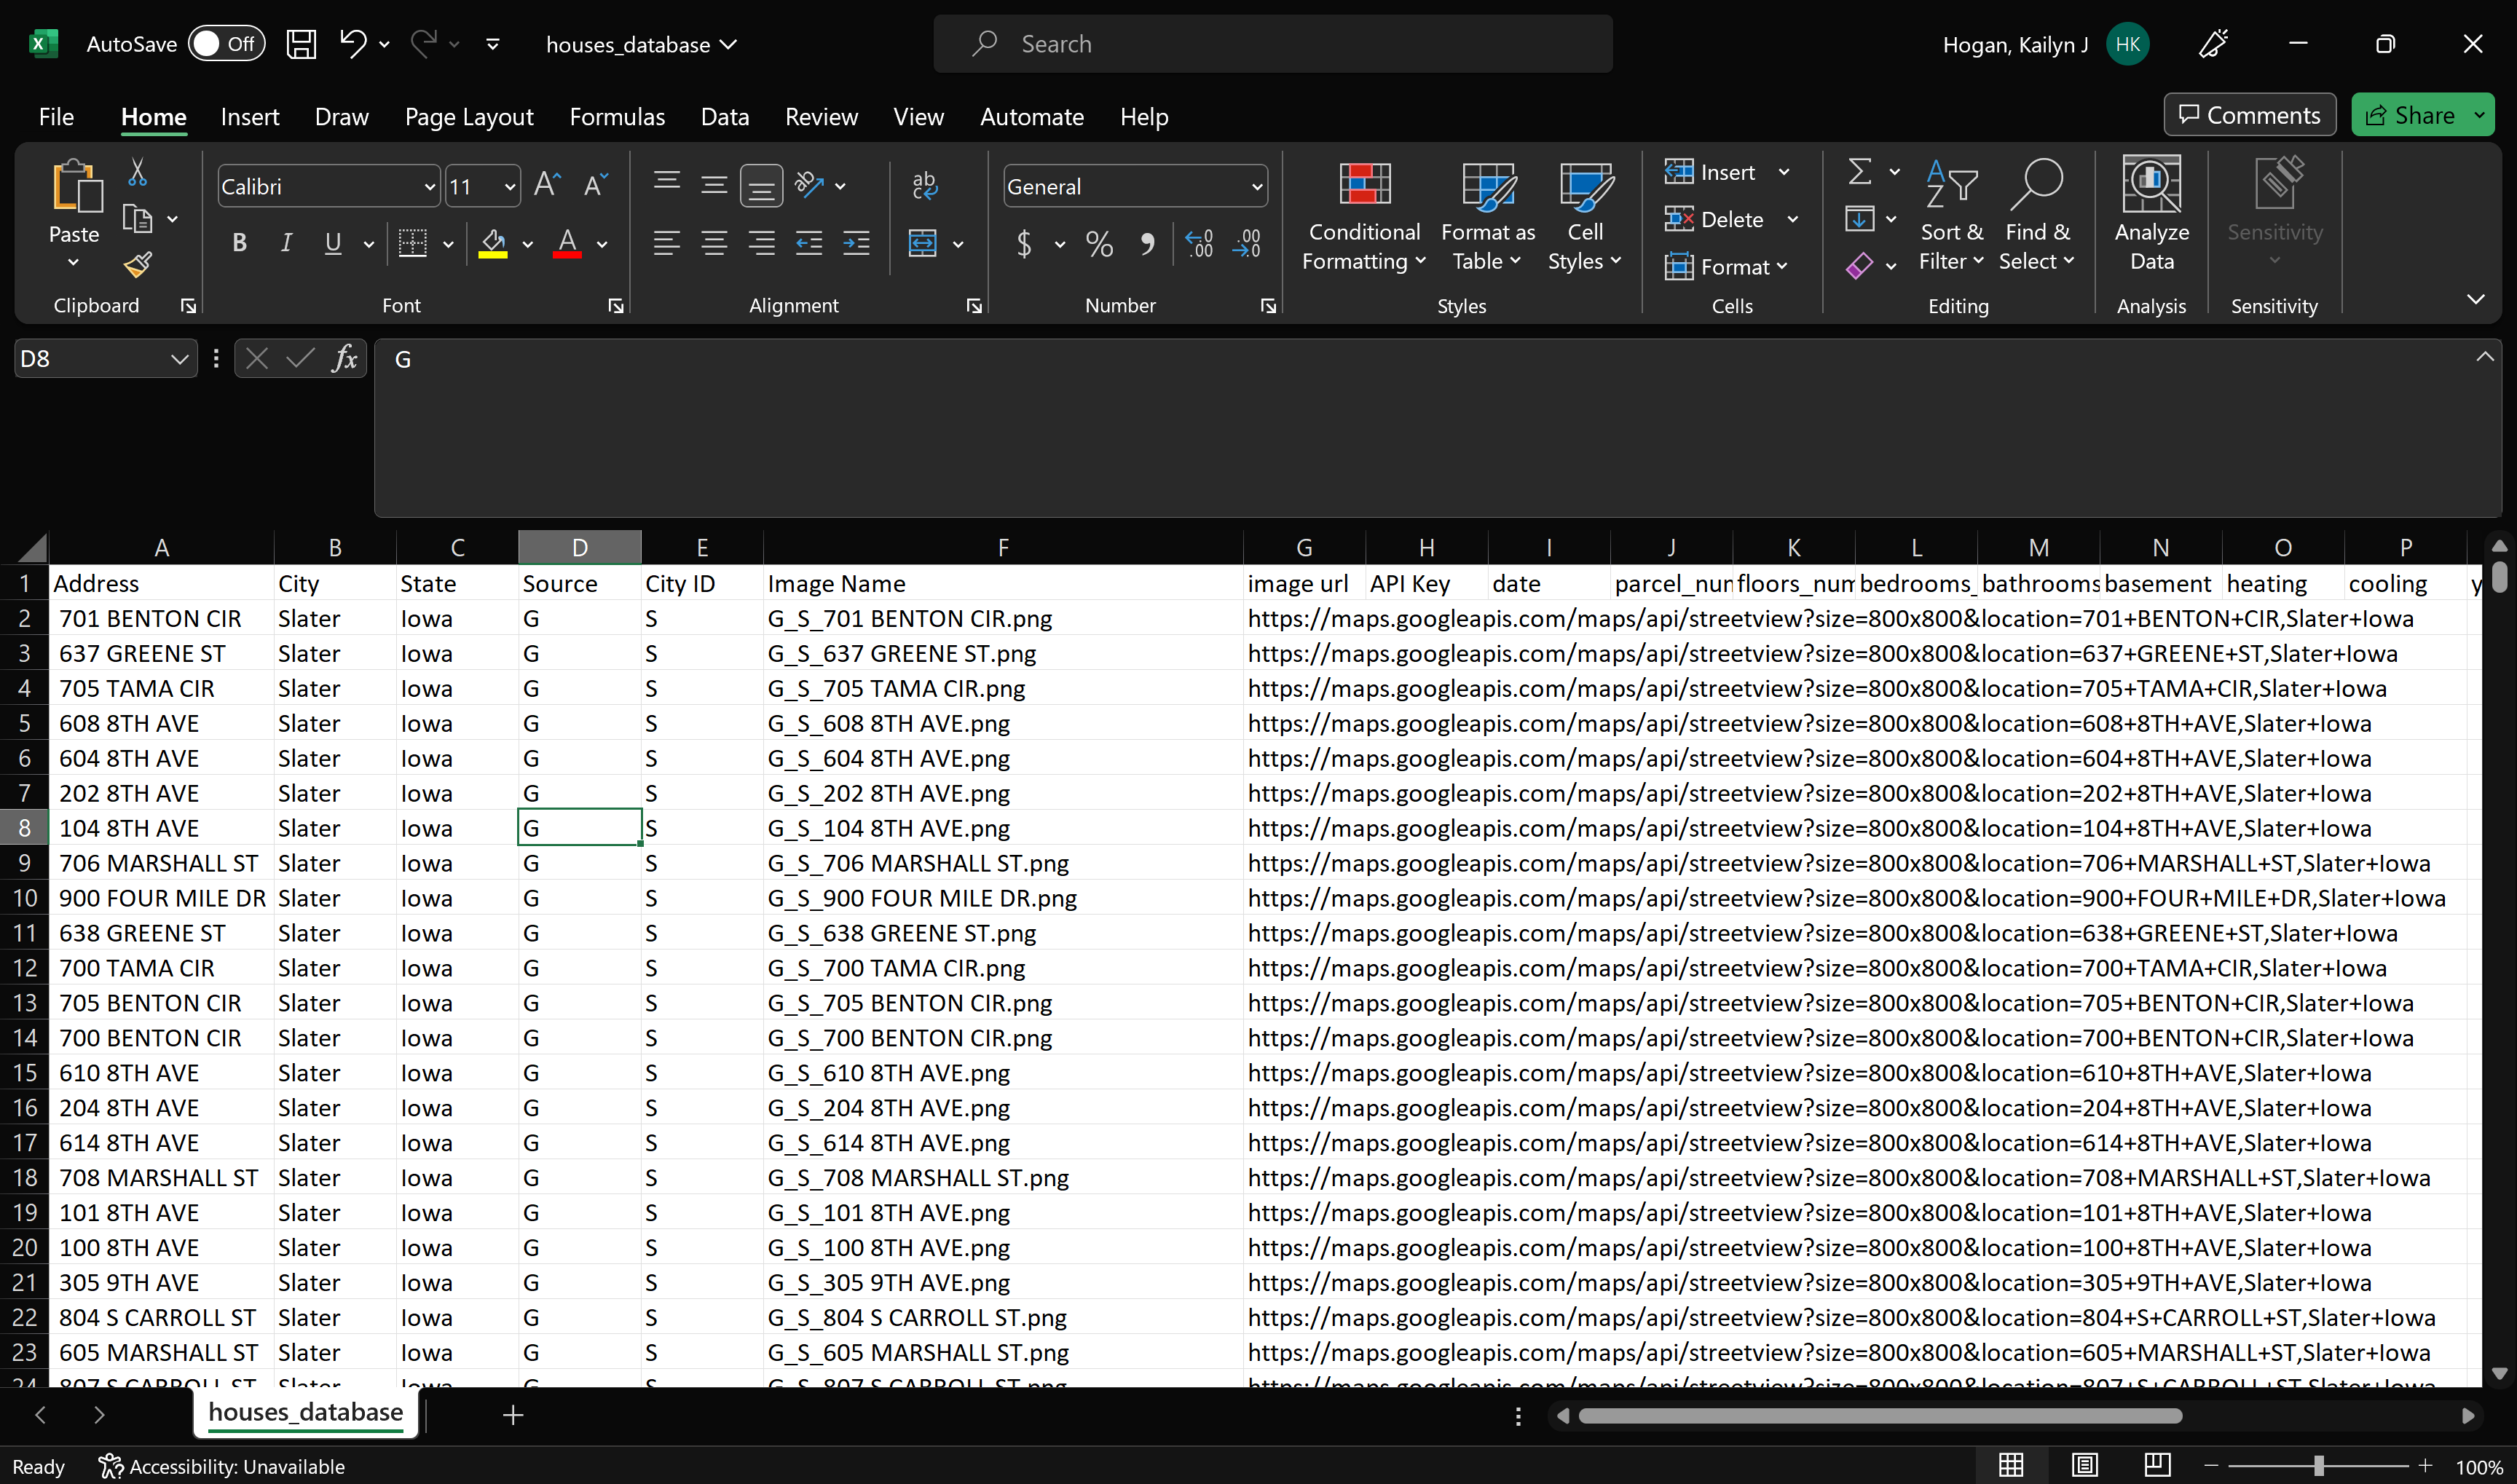
Addresses to Google Images
On top of the AI models we needed to start filling in other characteristics about the addresses which we have collected. Although there have been a few errors in duplicate images and incorrect addresses we were able to link what pictures we currently have from Google into CSV files for each city. We can continue to grab data from Zillow.com and start collecting on Realtor.com
Geospatial Mapping
In order to get a head start on spatial mapping which we will use as part of our end results demonstration, we took a look into Geospatial Mapping on Datacamp, got back into using the census data, and took a look at Kyle Walkers TidyCensus book (online free!).
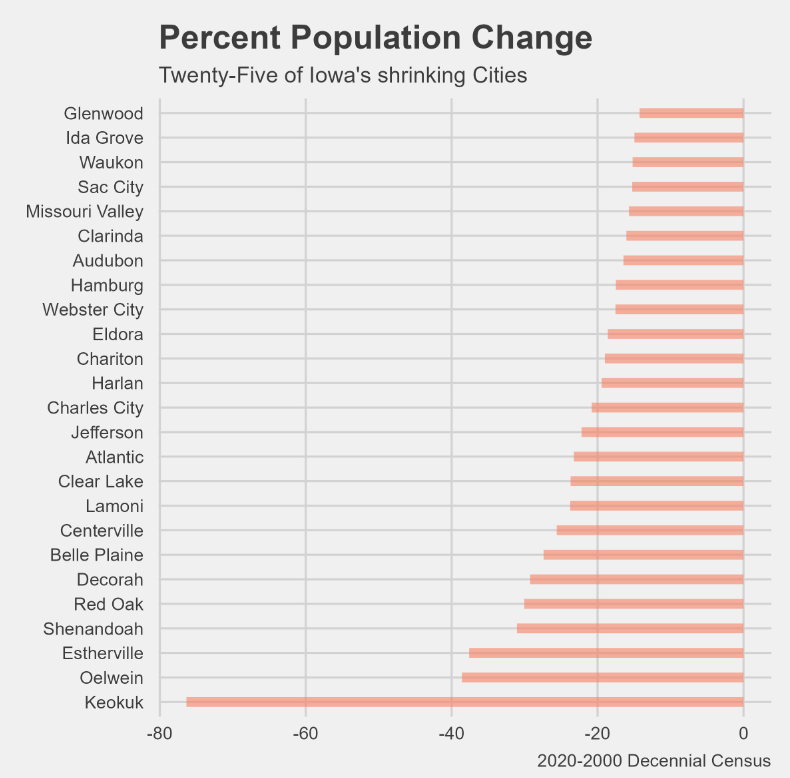
Using the US census data we started to look at changes in Iowa population from 2000-2020. 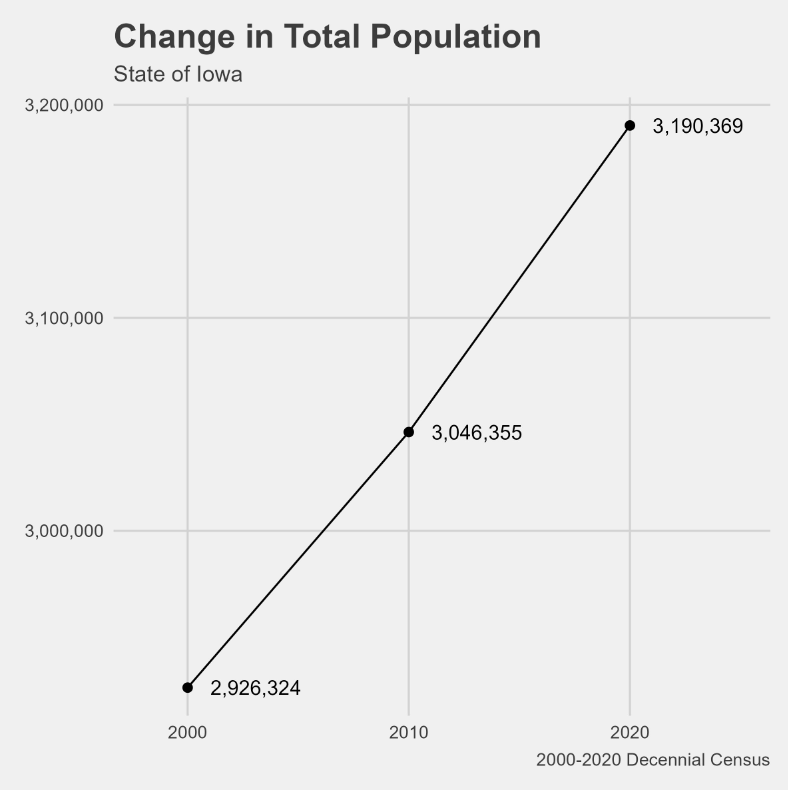
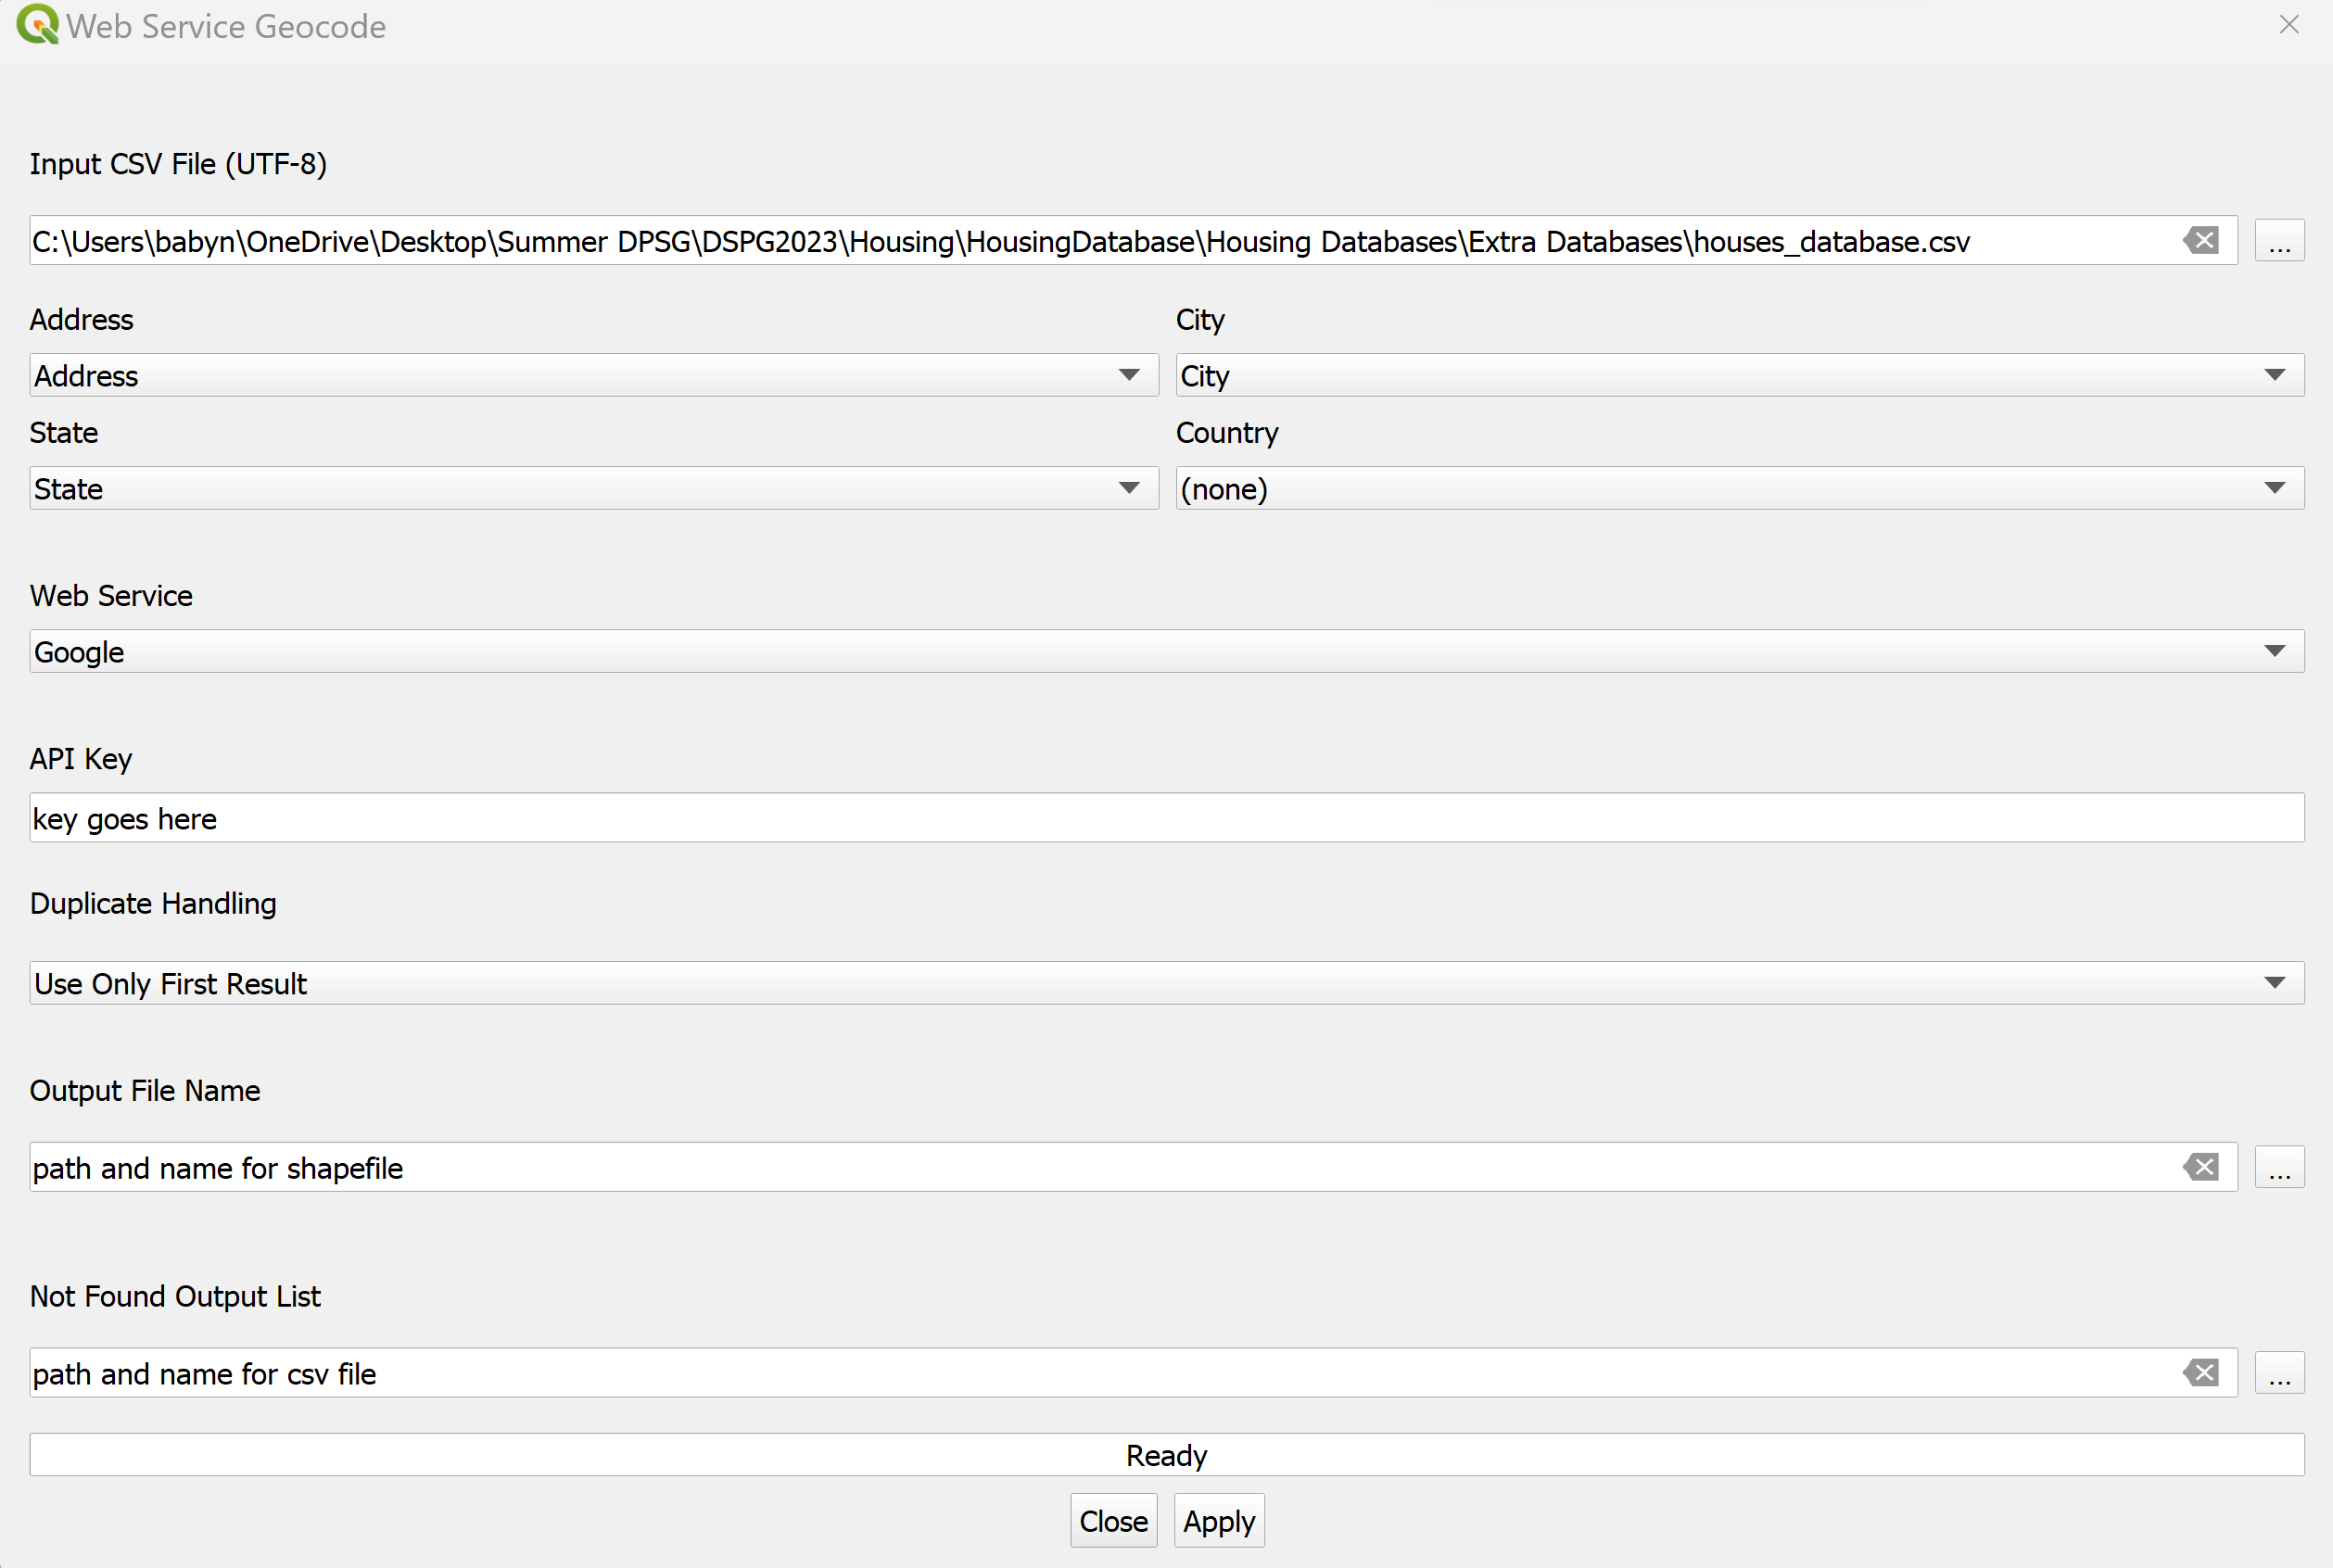
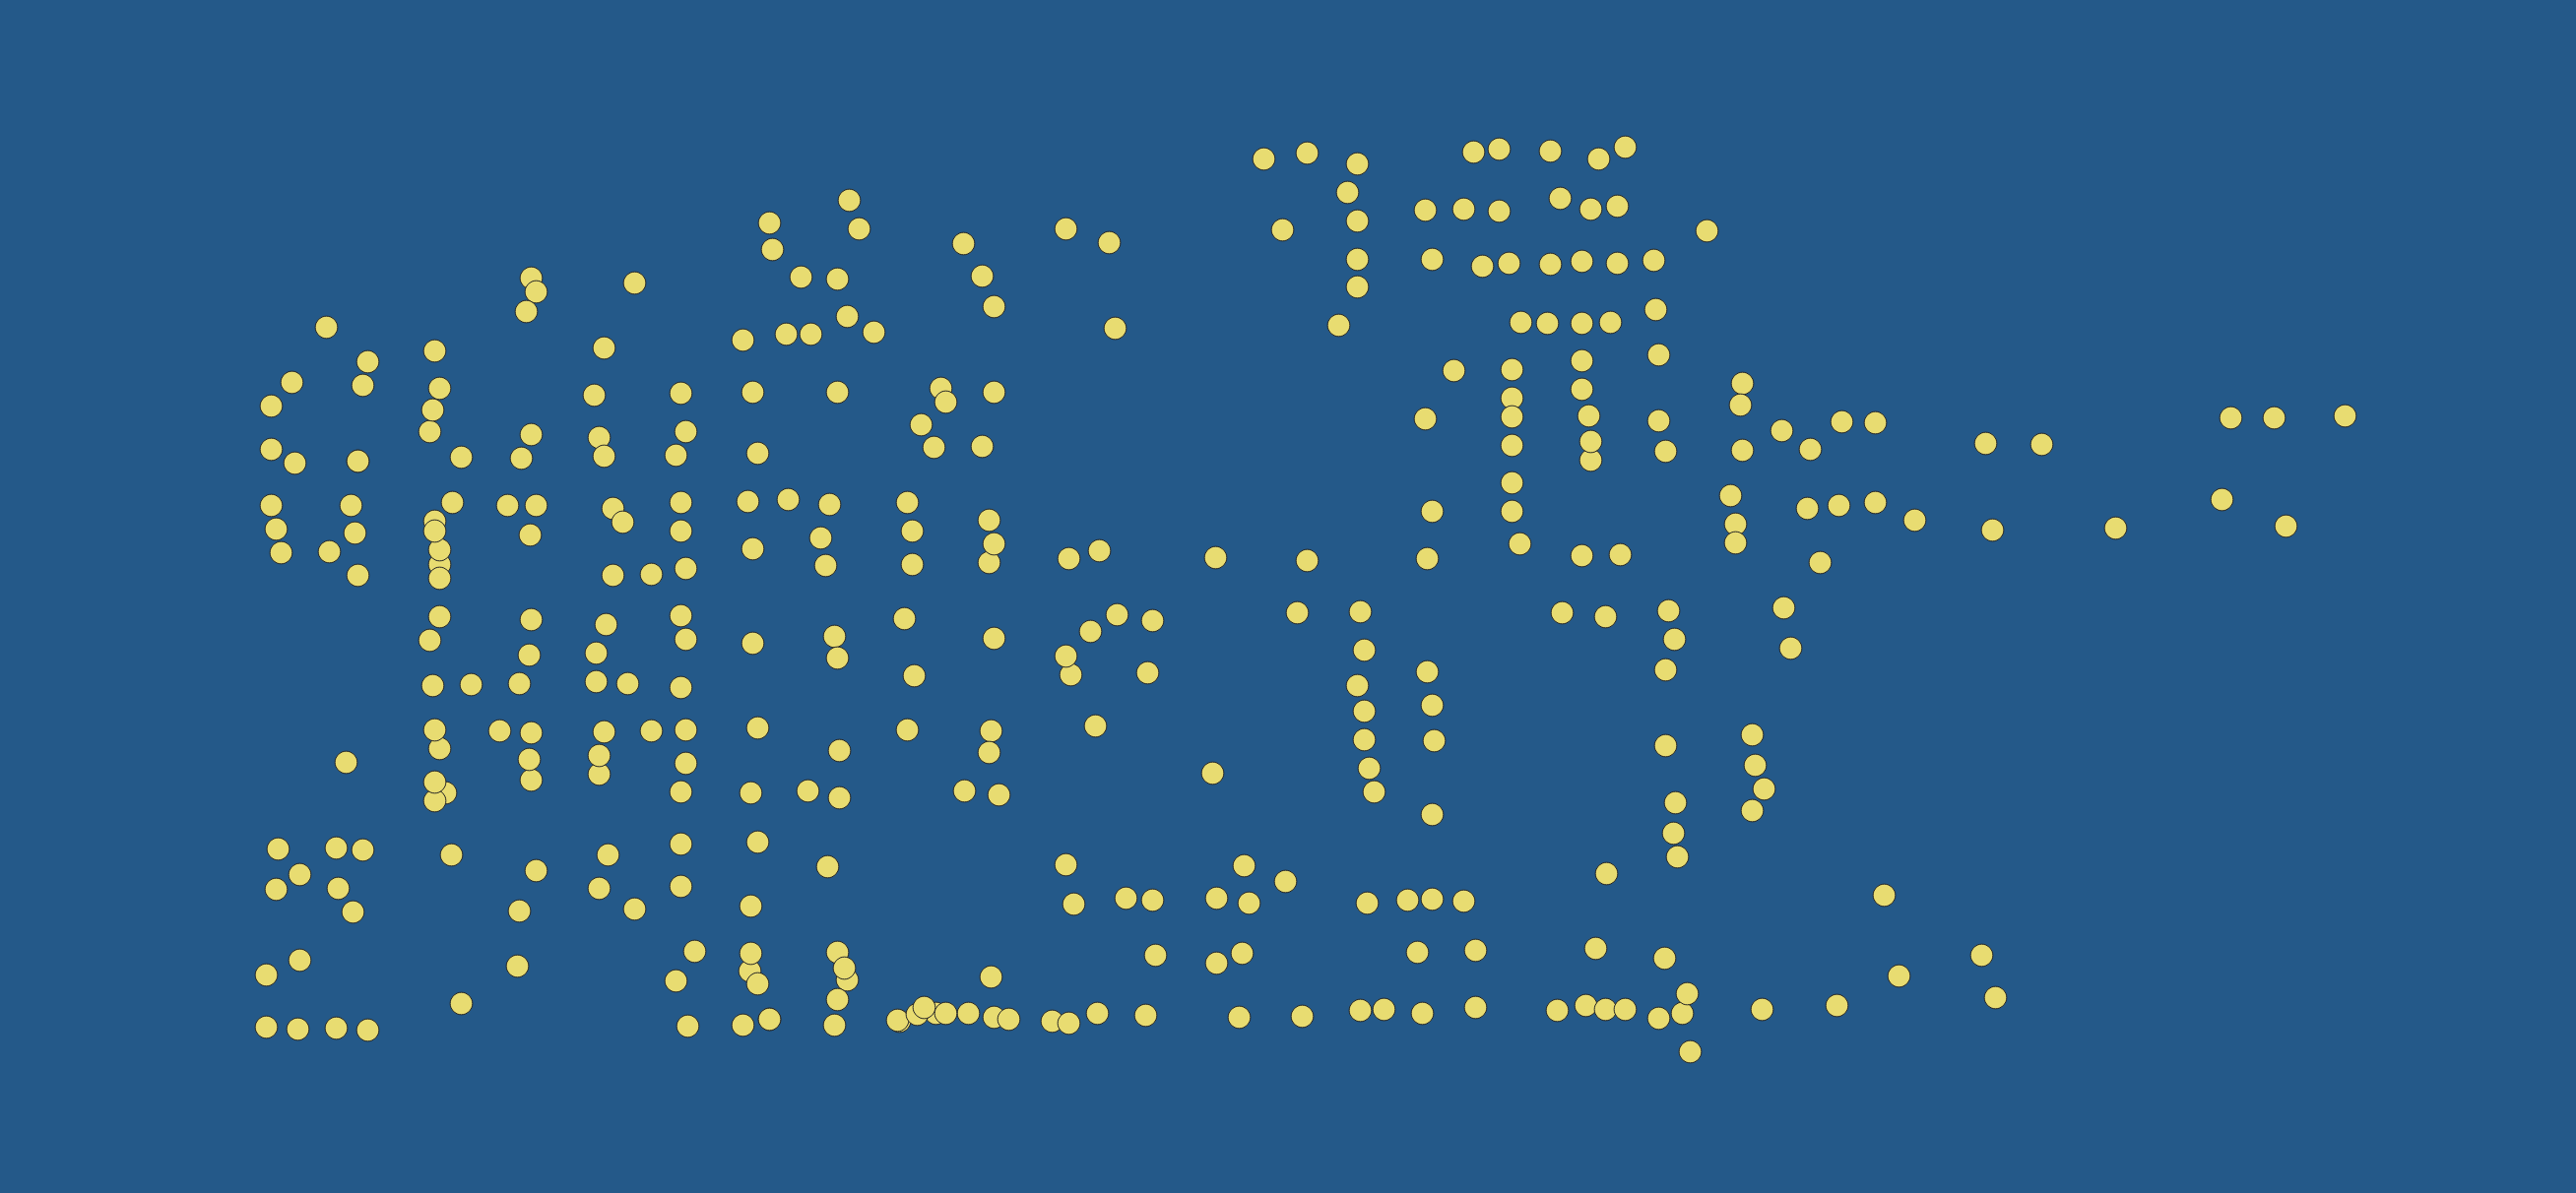
We tested out QGIS by mapping Slater and New Hampton using the lat long information off of the Google API.

ITAG Conference
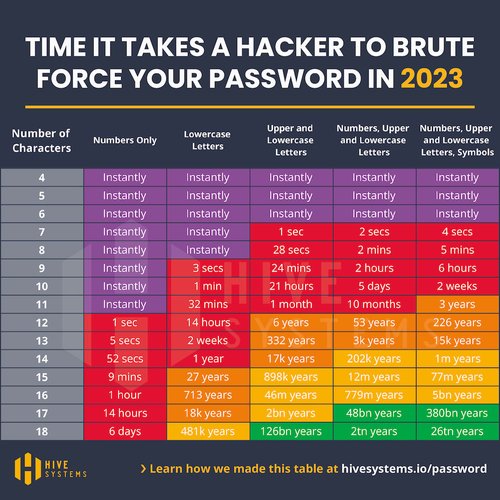
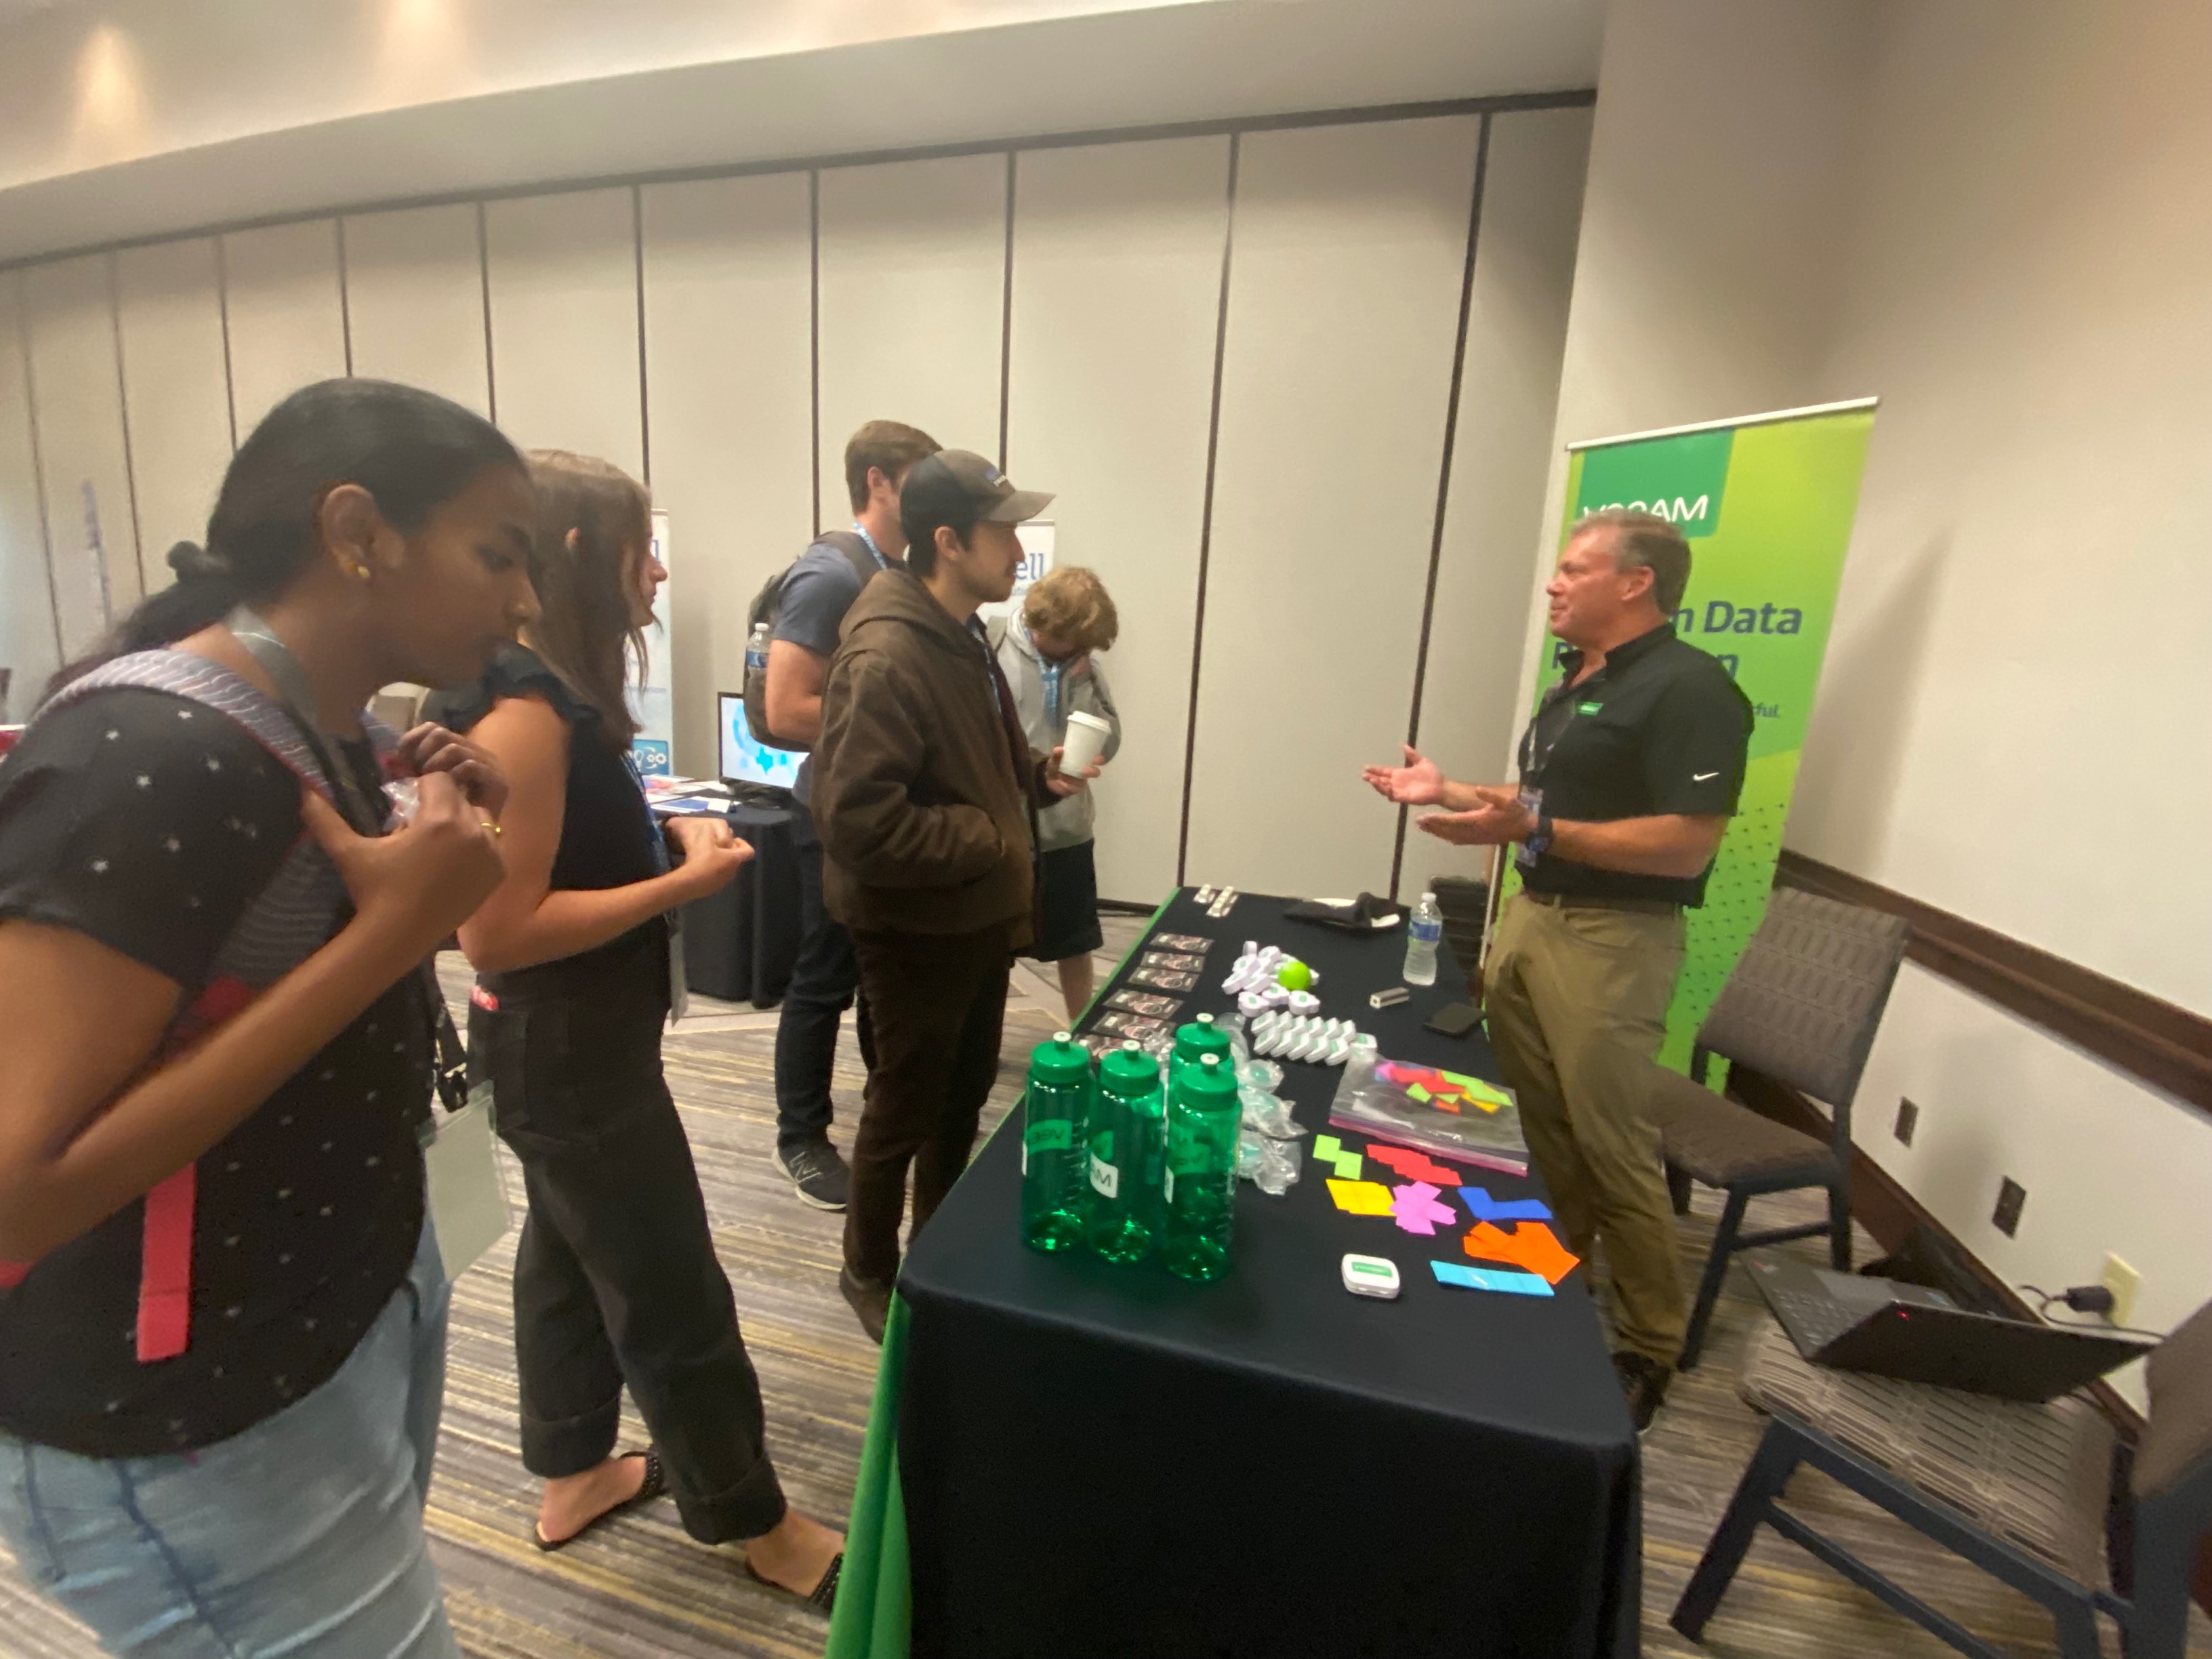
We were able to meet with many vendors to learn about their companies and introduce our program and project. There were also many talks about Cyber Security, GIS, and IT.
Presentations we attended: Modernize Your ArcGIS Web AppBuilder Apps Using Experience Builder by Mitch Winiecki, Bullwall by Don McCraw, ESRI Hands on Learning Lab by Rick Zellmer, Modernizing Utility Operations with ArcGIS by Chase Fisher, Ransomware & Other Cyber Risks: Making Sense of Cybersecurity Headlines and Actionable Items for Mitigation by Ben, and finally The Story of Water at the Missouri DOC and the new Hydrography and Wetland Modelling by Mike Tully. Link to full schedule
